Gathering insight from QR Code engagement
Analytics Dashboard
Launched 2023
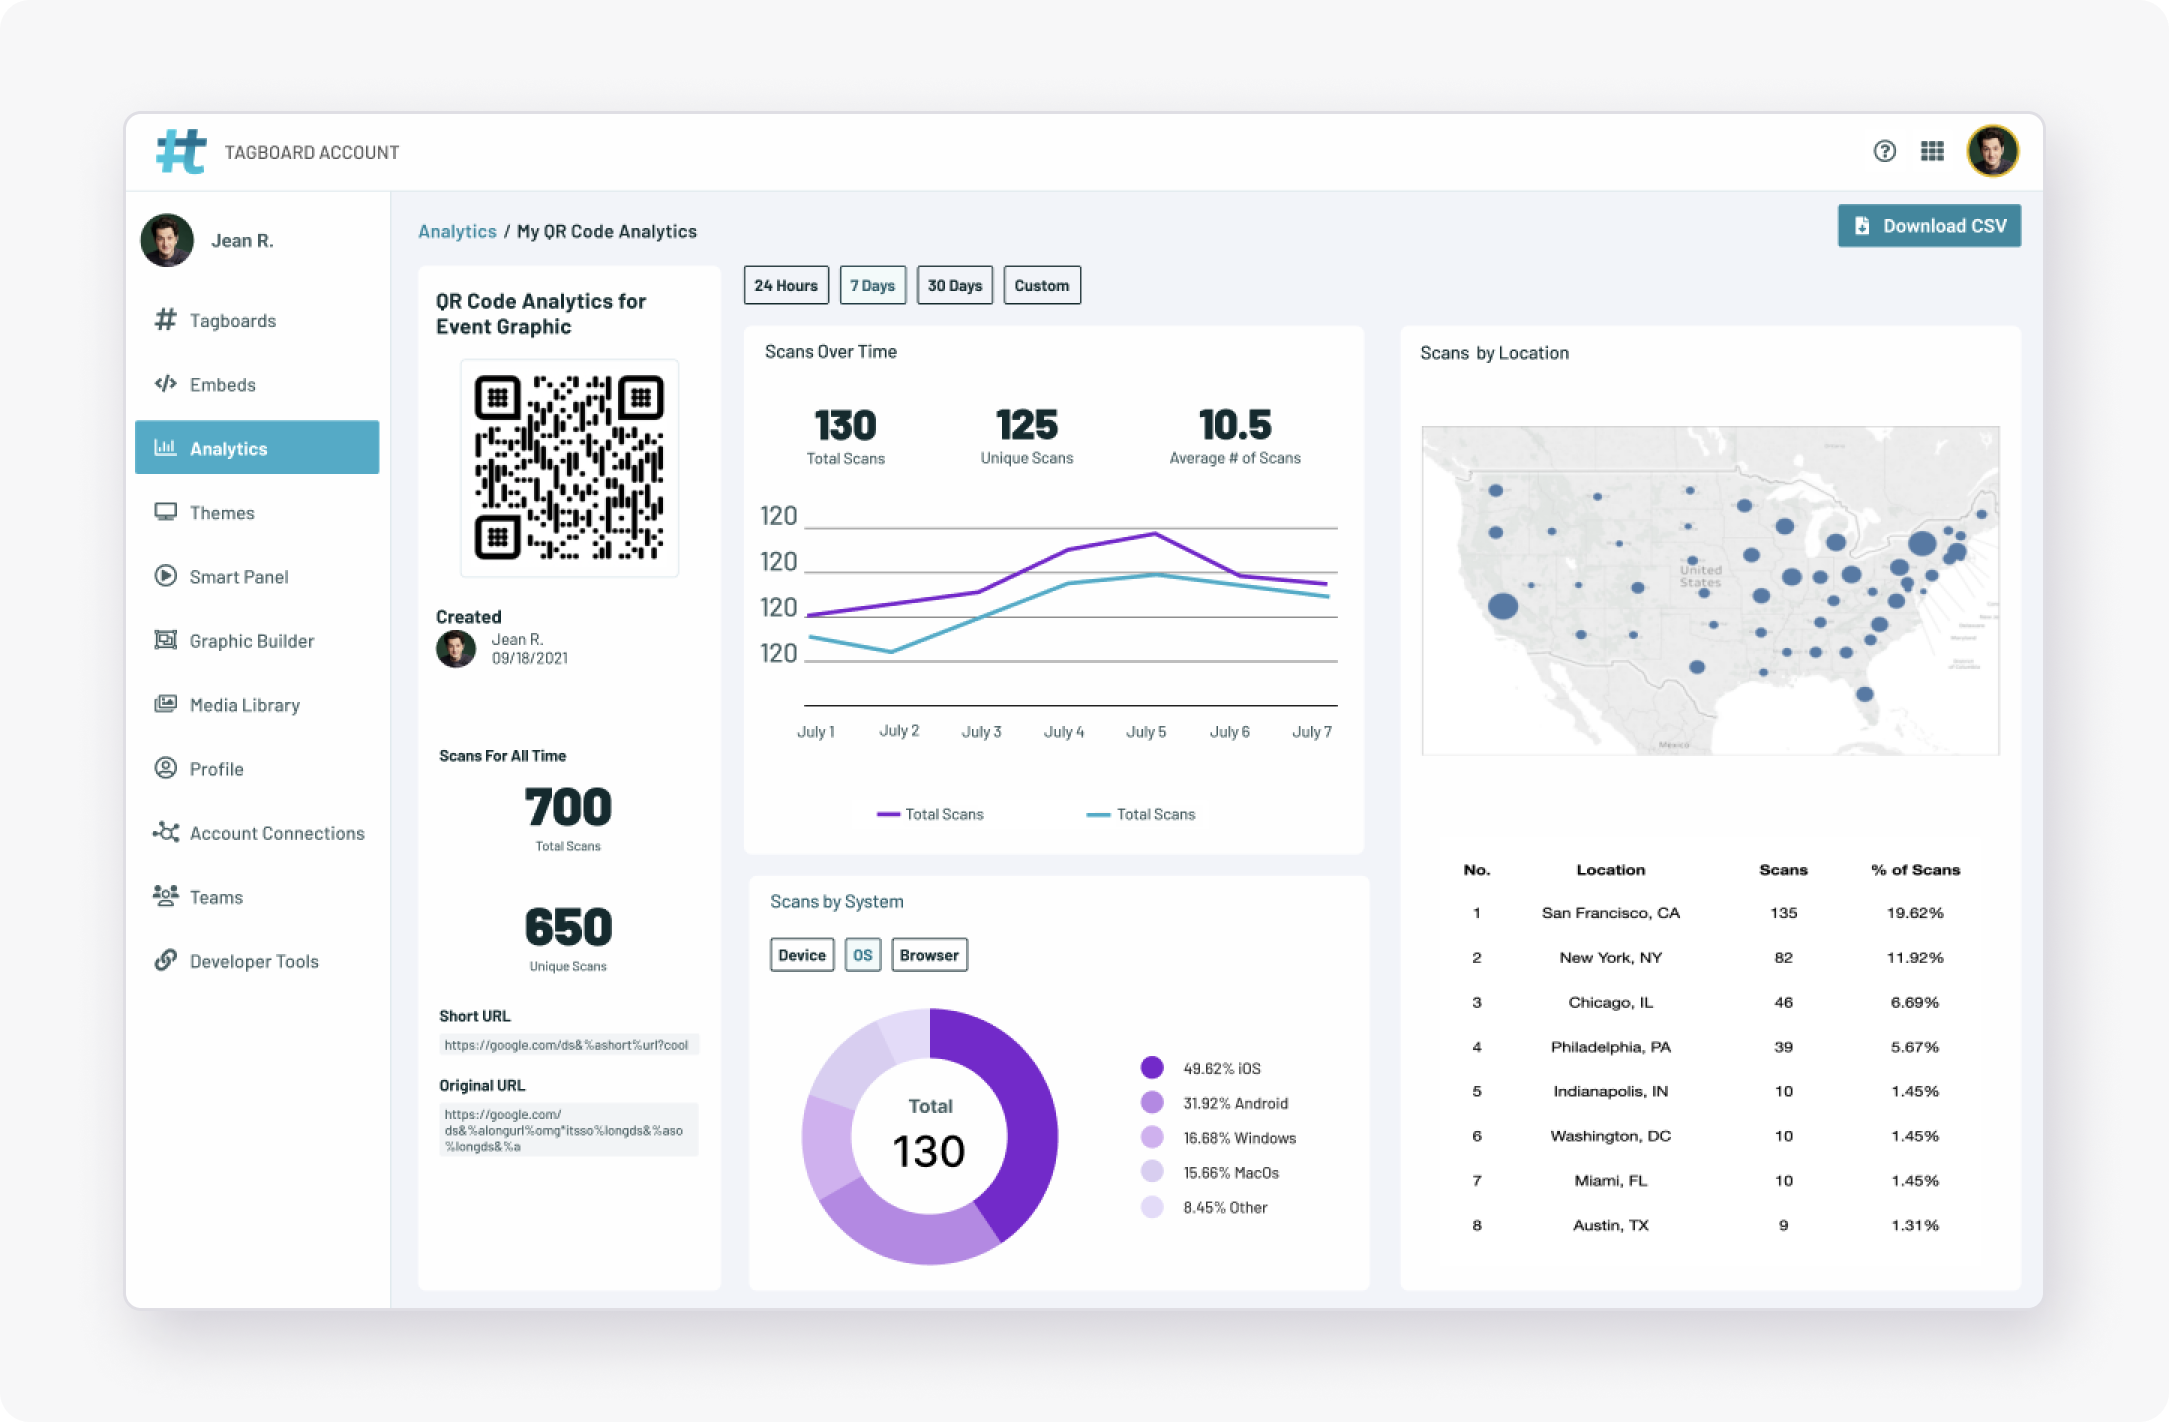
Detailed metrics on QR code scans over time, geographic distribution of scans, and system usage, providing comprehensive insights to enhance user engagement strategies.
Role
Product Designer, UXR, Visual Designer
Tagboard Inc.
Company:
Background
To address client demands for deeper insights into campaigns utilizing QR Codes, Tagboard recognized the need for a comprehensive analytical tool.
Clients sought capabilities to track real-time data, compare performances, and customize reports, crucial for optimizing content and demonstrating ROI. Thus, Tagboard introduced an Analytical Dashboard to empower clients with essential data intelligence for refining engagement strategies.
Business Goals
At this time, Tagboard was also looking for ways to increase engagement and conversion against competitors and reduce time in which user access valuable performance data. We already had a QR code generator, but how can we increase it’s value so users use us instead of third party software?
Client Needs and Wants
I conducted user interviews with several clients and internal Client Success Managers.
Together, they expressed a need for more sophisticated tools to measure and analyze their QR Code performance directly within Tagboard. Otherwise, they would go to competitors to create QR Code to use inside our product.
Common feedback included requests for:
Comprehensive Analytics
Clients needed detailed insights into how their content performed across different platforms, such as viewership numbers, engagement rates, and demographic information.
Specific requests:
Comparison Metrics
Tools to compare performance across different posts or campaigns to identify what strategies work best and why.
Real Time Data
The ability to monitor social media activity in real-time, allowing for quicker adjustments to content and strategy based on current trends and feedback.
Integration Capabilities
Requests for easier integration with other data sources or marketing tools to create a more holistic view of digital marketing efforts.
Customizable Reports
The need for more flexible reporting tools that could be tailored to specific goals or KPIs, making it easier to present results to stakeholders.
Mockups & Solutions
Backed by research and user insights, I collaborated closely with the PM on the best analytical dashboard. Using my science and research background, I led the direction and specific graphs to showcase specific data.
Introducing QR Code Analytics
Final Mockup
The analytics dashboard should be easy to comprehend no matter your title or level of expertise analyzing data. Many of our clients had teams with varying levels of QR Code and analytics.
Solution:
• Detailed metrics on QR code scans over time, geographic distribution of scans, and system usage, providing comprehensive insights to enhance user engagement strategies.
Collaboration
Analytic Dashboard
Monitor and Manage
Introducing a new dashboard designed for ease of monitoring and managing QR code usage and performance across various content campaigns. User also have option to show only QR Codes that have been scanned and have been highly engaged with.
Insights & Engagement
Scans by Systems for:
Device Optimization: Knowing which devices (mobile, desktop, tablet) are most commonly used to scan QR codes helps in optimizing content for those devices.
User Experience Enhancement: Understanding the operating systems (iOS, Android, Windows) that are predominantly used can guide decisions on tailoring user interfaces and functionalities that are more intuitive and responsive for those specific platforms.
Shortened URLs for:
Enhanced Tracking: When users scan the QR code or click on the shortened URL, Tagboard can track these interactions.
Ease of Sharing: Shortened URLs are easier to share, and remember whether in verbal communications, printed materials, or digital content.
Cross-Functional Collaboration
Product Design 🤝 Marketing
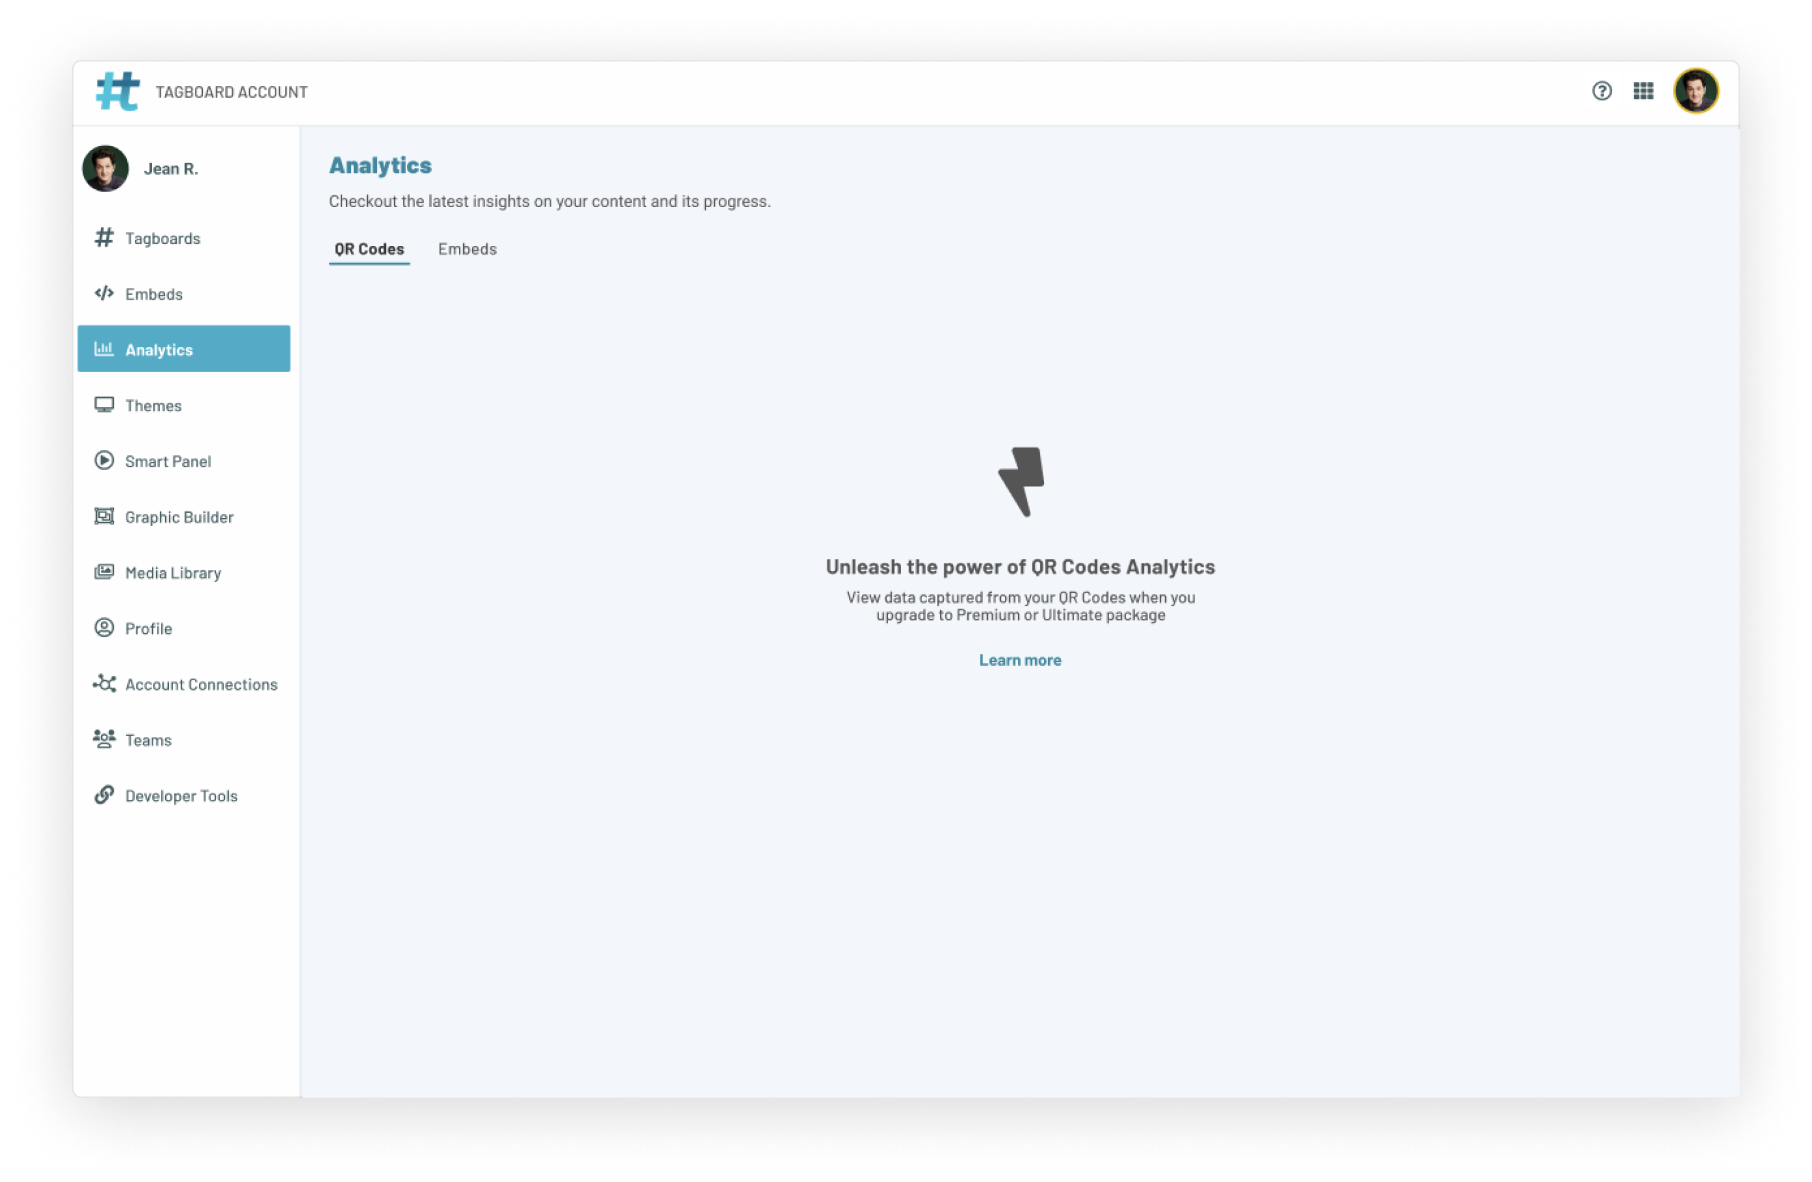
During this period, Tagboard implemented a tiered subscription model, introducing several new features, which I also led ;D , that required users to upgrade to higher tiers to access enhanced functionalities. Here, I was given the opportunity to exercise my UX Copy muscle in collaboration with Marketing. Utilizing our brand voice and actionable copy to increase engagement.
Final Live Product
Analytics: QR Code Dashboard
Data Visualization: QR Code
Post Launch Metrics
Upon the release of QR Analytics, Tagboard saw:
60 % increase in QR Code creation.
5 clients per month, on average, requesting upgrade to new analytics feature.
Future Scope
If I had more time I would address the additional feature request made by our users:
Advanced Filtering Options: Implement more granular filters that allow users to sort and view data by specific demographics, time frames, content types, or user engagement levels. This would provide deeper insights into campaign performance and audience behavior.
Heatmaps for Geographical Data: Besides the current map visualization, integrating heatmaps could offer a more detailed view of geographical engagement, highlighting hotspots where campaigns are performing exceptionally well.


